
Tips to Debugging Conditions in Sitecore Personalize
AI-Assisted Proofreading
All articles on this site are written by me. I use AI tools solely for proofreading and editing assistance to ensure clarity and accuracy.
Hello folks! I'm back at it again, and today I want to discuss debugging custom conditions in Sitecore Personalize. I have a lot of content coming up about conditions and was recently working with a colleague at Velir when I realized this would make a great blog topic. I actually considered writing about this years ago while working at Sitecore. Back then, I had created content about transitioning from XP-based pattern/profile cards to Personalize and tried implementing it in a condition. Unfortunately, I encountered numerous challenges when creating that condition.
Before diving into debugging methods, let's discuss some common gotchas I've discovered. Many developers new to the platform don't realize that the JavaScript required for these conditions is quite unique. This uniqueness often causes problems when creating assets in Sitecore Personalize.
Fortunately, as I've previously discussed here: First Look: Sitecore Personalize Code Assistant, there's now an AI code assistant that can help when starting to write a new asset. I highly recommend that developers begin with this AI code assistant and then modify the code to meet their specific requirements.
When working with an LLM, I find it helpful to specify that it should write ES5 syntax JavaScript and use print(); instead of console.log. Now, let's explore some common issues:
- You can't import libraries in Personalize conditions, with a few exceptions such as date imports.
- Avoid modern JavaScript syntax like
constorlet—these don't work in any JavaScript written for the Personalize/CDP platform. - Use
print('whatever');instead ofconsole.logfor outputting data. This is the only supported method for debugging output, which I'll explain in more detail shortly.
Debug Tip #1: Testing and Getting the Right Guest Context
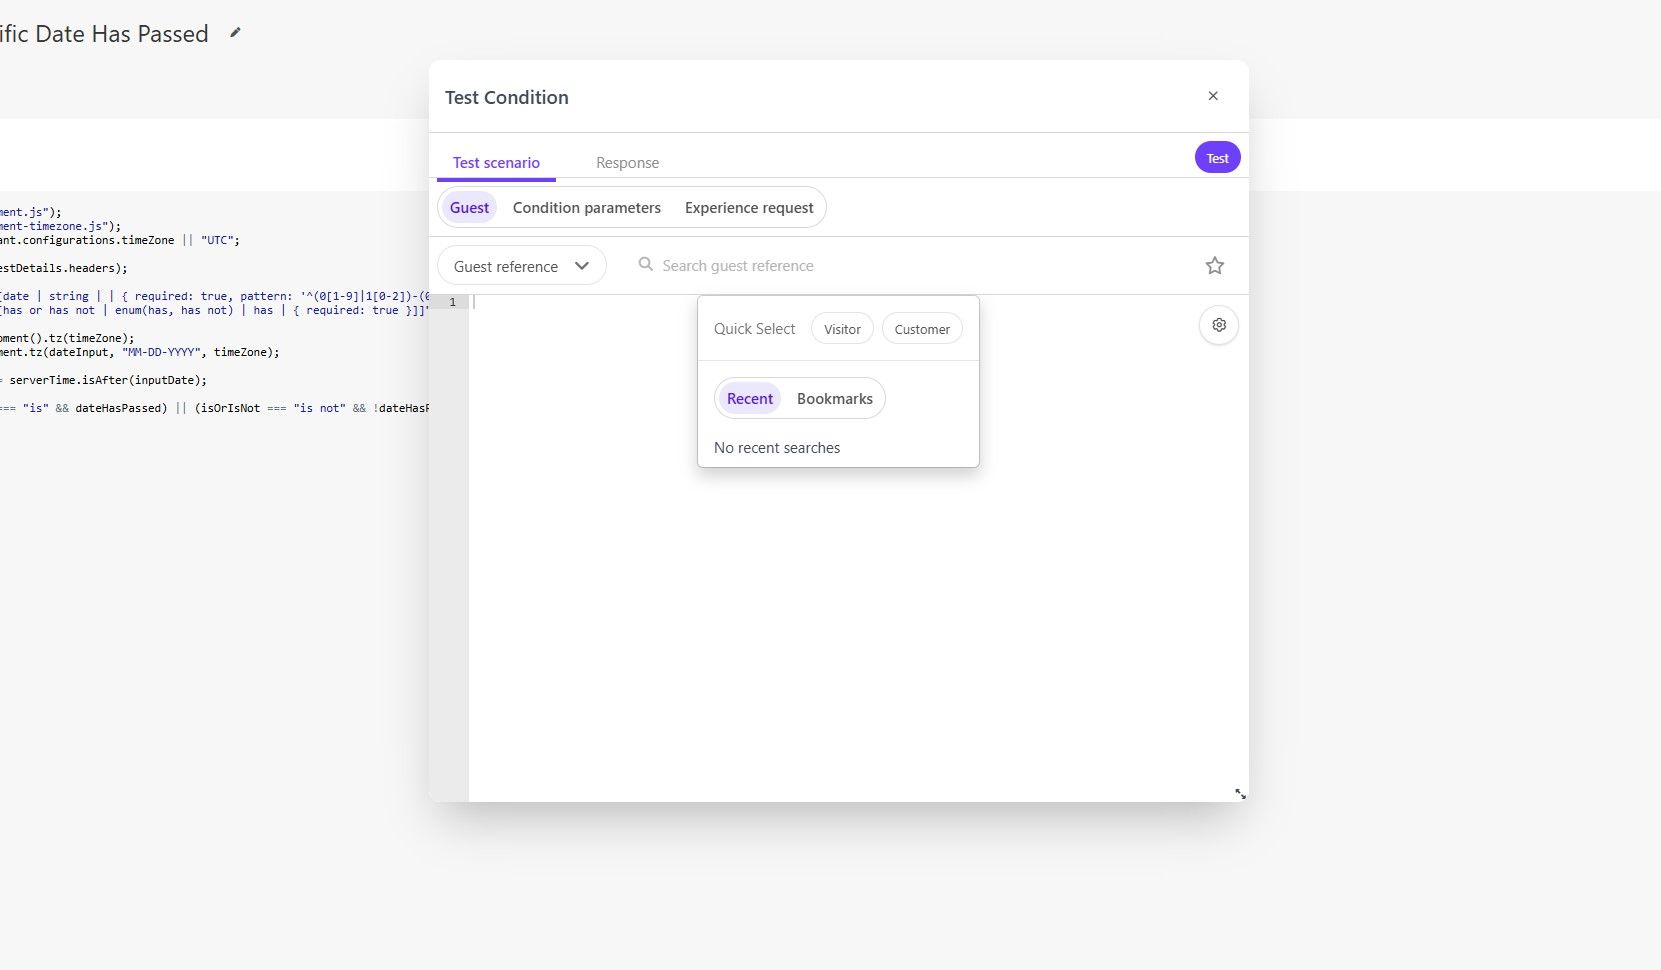
When creating a Condition in Personalize, you can test the output of your condition and various input combinations during development. Navigate to your condition and click the Test option to display a floating panel. The first option lets you select a guest profile for testing. This feature is valuable because you can choose guests who should either match or not match your condition's criteria, allowing you to verify both positive and negative test cases.
You might also want to test your own guest context. To do this, go to the site that has the Cloud SDK configured and type in the browser console scCloudSDK.core.getBrowserId(). This is similar to the old Boxever method but updated for Cloud SDK. This returns your unique Browser ID, which differs from your guest ID. Alternatively, you can call scCloudSDK.core.getGuestId(), which makes an API request to retrieve your Guest ID. Either ID will work for testing with your own user profile.
After providing the Guest information for testing your condition, you can then input the condition parameters based on the parameters/inputs defined in your code. These two options are essential for testing. When you click Test, you'll receive a true/false value. While this testing capability is crucial for debugging, remember that a successful test doesn't guarantee your condition will work as expected in XM Cloud or an Experience, or even pass validation. You might also encounter unexpected outcomes without understanding why. Let's move on to the second tip which, when combined with this first tip, will establish a solid foundation for testing conditions.
Debug Tip #2: Output Variables/Information
This second debugging tip is a fundamental technique for JavaScript developers: outputting variable values to verify your code is working correctly. For example, you might add a "hello world" message within a function to confirm it's being called, or check whether certain guest context information is accessible in Sitecore Personalize. The ability to output information during code execution is essential for effective debugging.
However, debugging conditions in Personalize requires a different approach than simply adding standard logging statements. Remember that console.log isn't supported—you must use the print function instead, as mentioned earlier.
You might also wonder how to run your code and where these print statements appear. As covered in tip #1, you need to test your condition against a guest profile with specific input parameters. This testing process is what enables you to see your debug output.
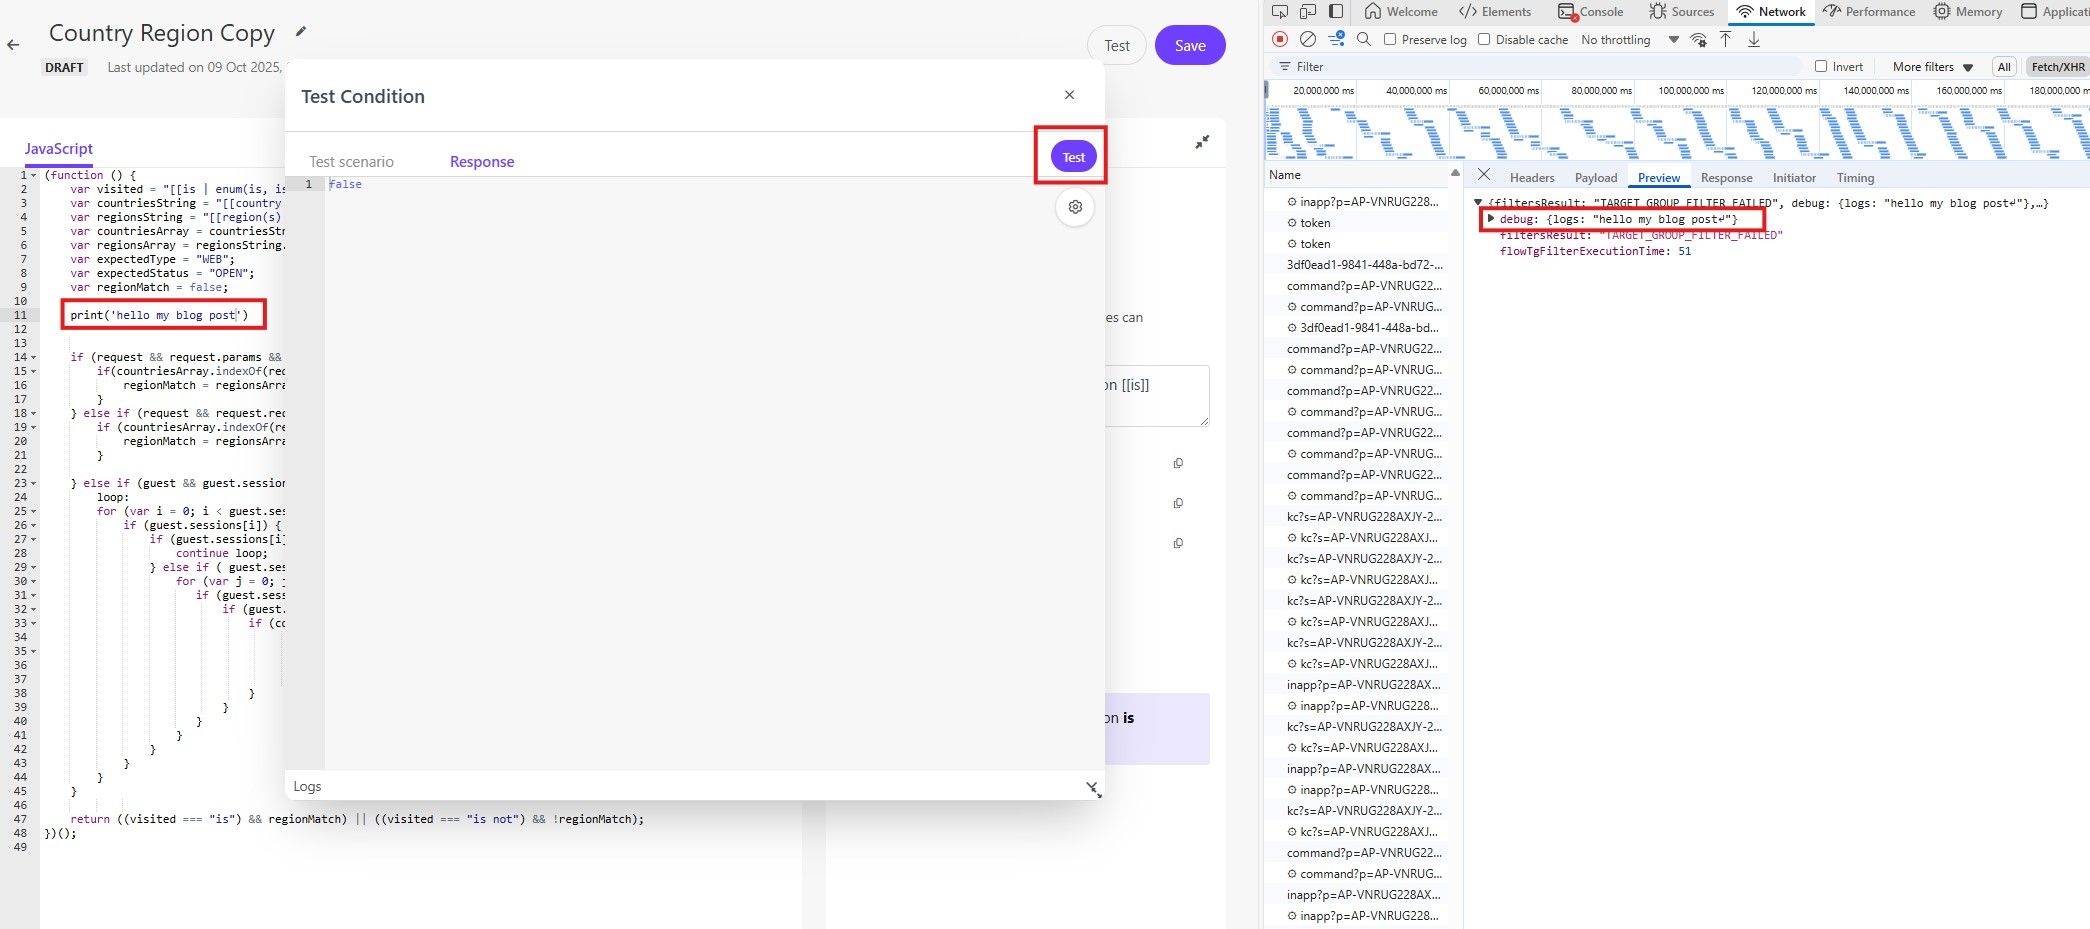
As shown in the screenshot, the debug information appears in an unexpected location after running a Test. This is because the Personalize platform lacks a dedicated debugging tab in the Test UI. To view your print function output, open your browser's inspector, find the most recent testTemplate request, and check its response. There you'll discover all the debugging information from your print statements.
That's it for tip #2. I initially had a third tip, but it was more relevant when I first drafted this article and I couldn't reproduce the issue this time. Nevertheless, I recommend that once you've created your condition, you should test it in both a Web Experience and within XM Cloud to verify it executes correctly. In the past, there were instances where conditions would pass basic validation tests and could be saved (since the platform performs basic script validation during saving), but would still fail when implemented in XM Cloud. If I discover this issue still exists, I'll publish a follow-up article on the topic.
That's all, folks! I hope these tips will help you next time you're creating conditions in Sitecore Personalize. Happy debugging!